QATrax LIMS Dashboards are here! When it comes to managing projects, metrics and dashboards are key. Our LIMS has its own dashboards and also integrates seamlessly with MS power BI to provide customized dashboards, so you can view data and metrics inside the most powerful platform for lab information yet created- QATrax!
We tailor dashboards to best work with your labs or you can create your own. You'll be able to see your data instantly and get insight to see issues such as if anything's going wrong or why performance has fallen off - all thanks simply because we've made it possible by developing our own dashboards and integrating our software into Power BI'.
TraxStar is enabling the creation of custom dashboards for our customers for essential metrics like cycle time, productivity, and equipment utilization.
This aids our clients in allowing Engineering Management Teams to make data-driven, informed decisions that will help them advance their lab operations. They appreciate seeing their lab Key Performance Indicators (KPIs) in graphical form and evaluating their data to meet more of their company objectives.
Why use LIMS Data Analytics Tools with Dashboards?
Data analysis tools provide an overview of laboratory data, allowing for the following:
- Identification of outliers
- Process optimization by identifying and eliminating waste
- Improved understanding of the business
- Timely identification of issues
- Assessment of staffing needs
- Evaluation of laboratory performance.
From insight to action
In today's test laboratories, dashboards have evolved into a critical instrument for data-focused decision-making, leading from insight to action.
Managers of engineering laboratories may use these dashboards to investigate their labs and analyze the data they provide, giving them more insight into how well or poorly things are progressing at any one moment.
Make decisions based on real-time data and see how they stack up against your goals.
This makes managing projects more accessible than ever before and helps managers generate better reports with their data, which allows them to keep their business running smoothly.
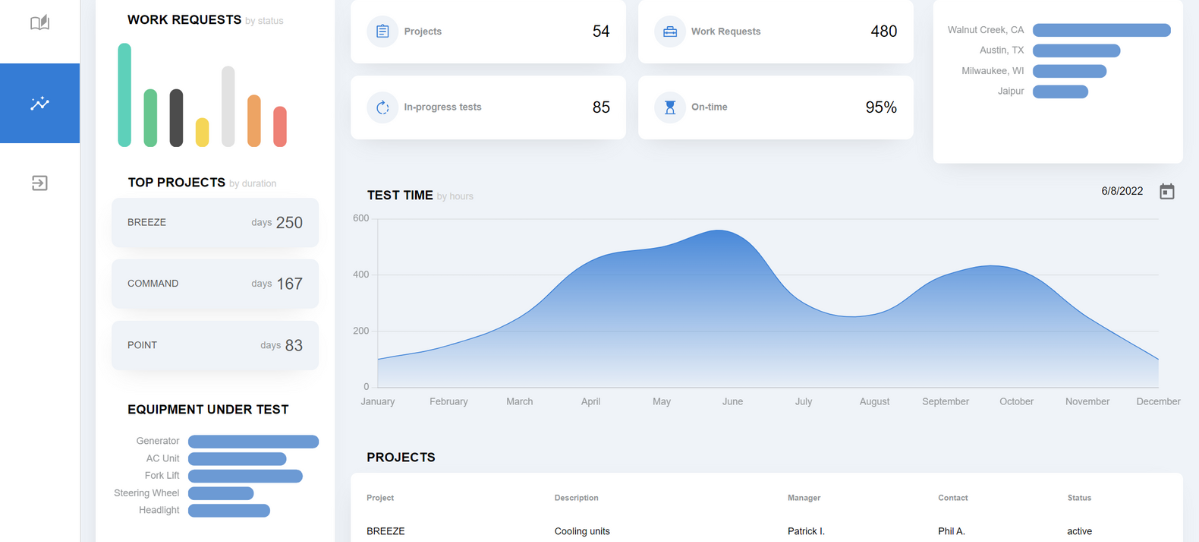
The current status of the laboratory can be seen on the lab testing overview dashboard.
Charts, Graphs, and Tables
Our software QATrax helps improve efficiency with our own dashboards or custom LIMS dashboards built with our Power BI integration. These dashboards show graphical charts, graphs, and tables.
Lab operation is a complex process. Many factors need to be monitored to ensure its efficient running. Data is collected in real-time and then processed and analyzed. The findings are utilized to produce reports that assist supervisors in making better lab management decisions.
For example, you can use data to create a dashboard that monitors the efficiency of a lab's operation. The data is sourced from our QATrax LIMS customization and is used to generate graphs and charts that help managers quickly make decisions to solve complex operational problems.
A laboratory information management system paired with a dashboard is the precise insight lab managers require to keep laboratories operating effectively!
QATrax has its own dashboards but we also allow for Power BI integration so your business team can handle your own custom dashboards or you can engage our services to build your own custom dashboards.
Backlog of jobs and identify bottlenecks.
The Dashboard displays jobs for which lab tests bottlenecks are revealed at a glance into your workflow that can quickly be mitigated. Easily see insights in real-time such as over capacities on workloads of tests with available technicians, etc., which can be used to swiftly adjust actions in your labs to prevent issues before they occur.
Lab tests. Overview
LIMS software QATrax can be used to monitor general laboratory activities daily. This overview of laboratory status includes a list of completed or continuing tests, status, the remaining tests, and more.
The QATrax Lab Testing Overview Dashboard features give intuitive insight for easy access. The lab tests overview ultimately assists in educating the lab manager about the entire lab process, but the benefits do not include just one person. Dashboards paired with QATrax will help improve employee accountability.
Equipment Utilization
Utilizing your equipment is one of the most critical metrics for our customers. QATrax LIMS, was designed to help you get more out of every investment we make so that it meets or exceeds what's expected from a customer experience at all times! This means developing automated rescheduling logic, which identifies scheduling gaps when things start getting behind so they can be fixed ASAP before any downtime occurs due to these issues. This ties into dashboards with further oversight into how things are progressing.
Value For Lab Managers
A laboratory manager can use a dashboard to get valuable information about the laboratory. The data can help the manager understand what is happening in the laboratory and how the laboratory is being used in real-time. The dashboard can provide the manager with user-based information, which can help make decisions about the laboratory.
This is essential for lab managers to make informed and speedy decisions about the laboratory and its user basis. By monitoring trends and developing forecasts, laboratory managers are better equipped to make informed decisions about the laboratory as a whole and its users while keeping the lab flow operating at peak efficiency.
They may use data analytics and visualization tools to see how the laboratory is being utilized and spot areas for improvement. Lab data might also assist managers in determining how their staff are doing and highlighting any issues that may arise.
Lab data can also help ensure regulatory compliance. Having accurate and up-to-date information about the laboratory can help managers stay compliant with all applicable regulations.
How To Get Your Custom LIMS Dashboard
We're creating dashboards to help our customers make informed data-driven decisions and analyze their lab KPIs. Our customers value the ability of engineering management teams to get valuable insight displayed in dashboards, who have been struggling with too much information overload in order to reach out to reach more business goals.
Data analytics with QATrax Dashboards is a powerful tool that should be used by all businesses using LIMS in their test labs to improve their effectiveness.
Contact us today to learn more about how we can help you get the most out of your data and how dashboards can benefit your labs specifically.